pacman::p_load(rstatix, gt, patchwork, tidyverse)In-Class_Ex04
exam_data <- read_csv("data/Exam_data.csv")Rows: 322 Columns: 7
── Column specification ────────────────────────────────────────────────────────
Delimiter: ","
chr (4): ID, CLASS, GENDER, RACE
dbl (3): ENGLISH, MATHS, SCIENCE
ℹ Use `spec()` to retrieve the full column specification for this data.
ℹ Specify the column types or set `show_col_types = FALSE` to quiet this message.Plot
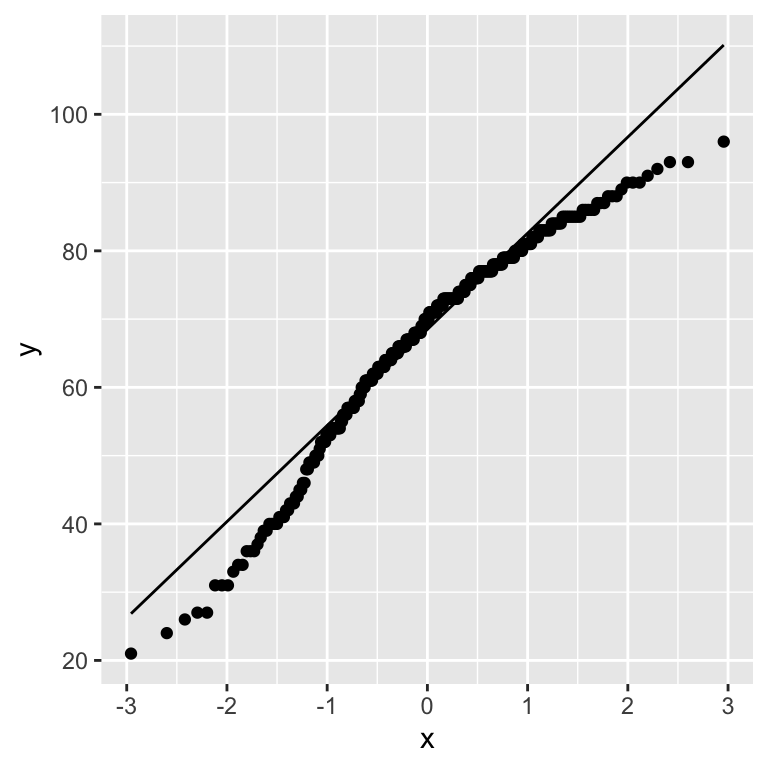
ggplot(exam_data,
       aes(sample=ENGLISH)) +
  stat_qq() + #normal distribution
  stat_qq_line()
Note
We can see that the points deviate significantly from the straight diagonal line
Plot (patchwork)
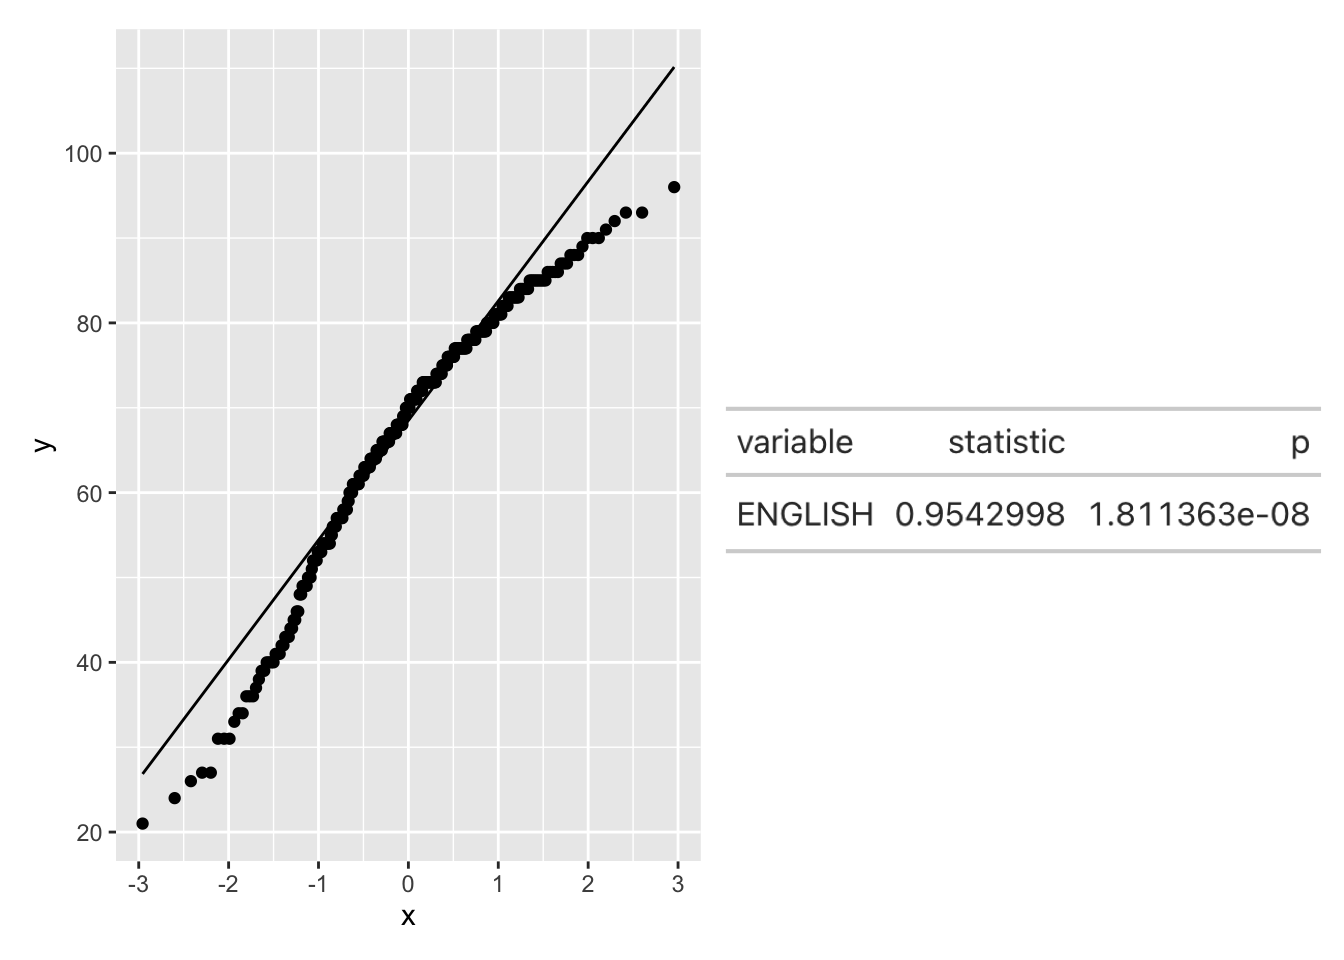
ggplot(exam_data,
       aes(sample=ENGLISH)) +
  stat_qq() + #normal distribution
stat_qq_line()set.seed(1234) #impt esp for variance statistics. to not change values everytime we run````{r} #